Annotation Design Space & Taxonomy

Read Paper
A Qualitative Analysis of Common Practices in Annotations: A Taxonomy and Design Space
Md Dilshadur Rahman, Ghulam Jilani Quadri, Bhavana Doppalapudi, Danielle Albers Szafir, Paul Rosen
IEEE Transactions on Visualization and Computer Graphics
Supplemental ↗
✦ Overview

Contributions

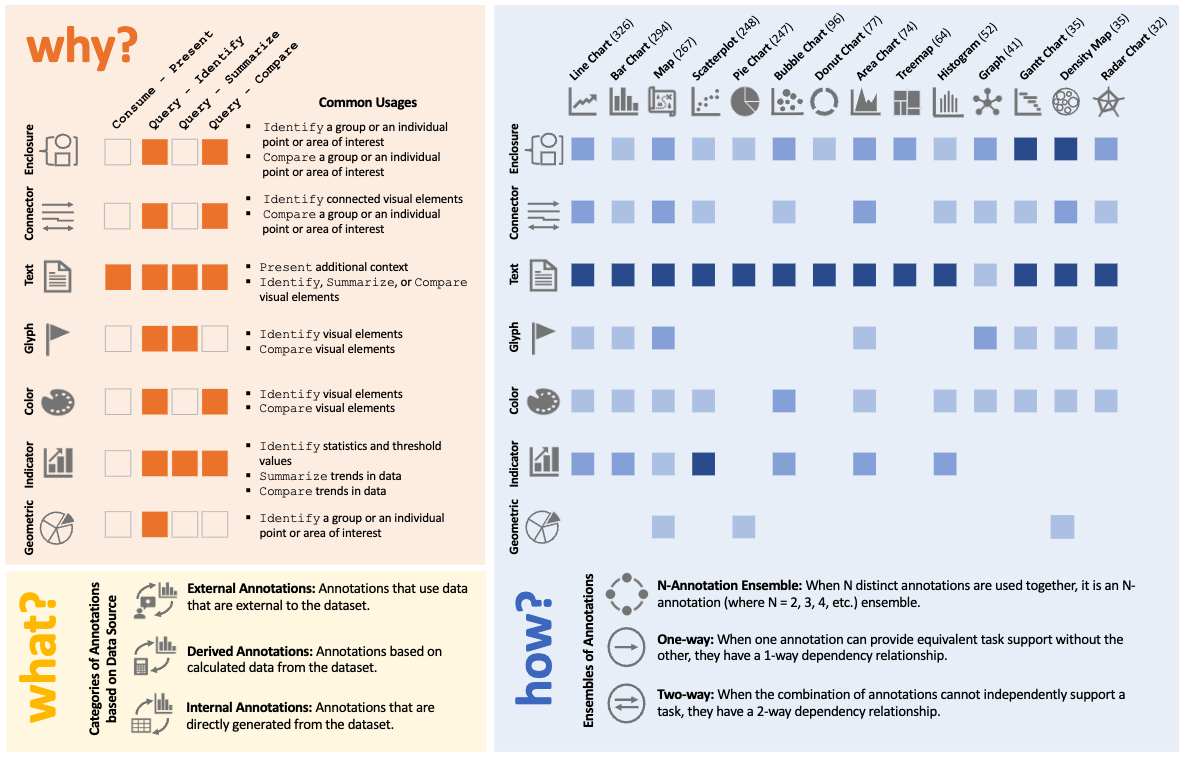
A corpus-based qualitative analysis of 1,888 annotated charts across 14 chart types, yielding a seven-type taxonomy and a three-dimensional design space that structures annotation decisions around task intent, visual form, and data provenance.

Key Findings

The paper’s core result is a practice-grounded framework for annotation design. From 1,888 real-world charts, it derives a taxonomy and a structured design space that helps researchers and practitioners reason about annotation decisions across chart contexts.

Taxonomy Contribution: Through qualitative analysis of N=1,888 annotated charts across 14 chart types, the study identifies seven recurring annotation types. This gives the visualization community a shared vocabulary grounded in observed practice, not idealized examples.
Design Space Contribution: The actionable [Why], [How], [What] framework links task intent, annotation mechanisms (including ensembles), and annotation data source. It turns annotation choice into a structured design process that can be taught, compared, and applied across domains.
Community Implication: The paper contributes a reusable dataset and demonstrates the framework with case studies. Together, these resources support future tool design, empirical evaluation, and reproducible annotation workflows in visualization research and practice.
✦ Design Space

Why, How, and What

The design space structures annotation decisions along three dimensions: Why — the analytic task the annotation supports; How — the visual type and ensemble configuration; and What — the provenance of annotation content. Each dimension is independently selectable yet jointly determines annotation appropriateness.

Original design-space figure from the paper showing Why, How, and What relationships across annotation types
Original design-space figure from the paper. Left: task support by annotation type (Why). Right: annotation usage by chart type and ensembles (How). Bottom: data source categories (What).

Design Space Guide

Why — Task intent: Begin with the analytic goal. Identify is the most broadly supported task across all seven types; Present is served almost exclusively by text annotations.
How — Form and ensemble: Select the annotation type appropriate to the task. Most charts use ensembles—text, connectors, and enclosures appear together more often than independently.
What — Data provenance: Content source is orthogonal to visual form. The same annotation type can draw from internal values, derived statistics, or external editorial content depending on communicative intent.
✦ Methodology

Dataset Construction

The corpus was assembled through systematic web retrieval and iterative exclusion filtering, then subjected to qualitative open coding until categorical saturation. The process is designed to ensure the taxonomy reflects observed annotation behavior rather than hypothetical or idealized examples.

Cropped methodology figure from the paper showing collection filtering and coding workflow
From 8,768 retrieved images, only 1,888 passed screening for qualitative coding across 14 chart types. This filtration is what grounds the seven-type taxonomy in real-world annotation practice.

Study Design

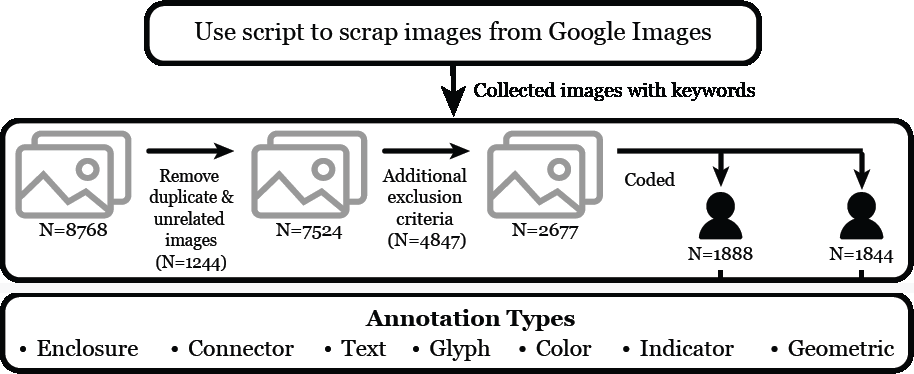
Starting from 8,768 images retrieved via Google Images, the corpus was reduced through successive exclusion rounds—removing duplicates, non-data graphics, and ambiguous examples—before iterative open coding. Coding continued until no new categories emerged, ensuring taxonomic completeness.

Collection: Large-scale retrieval of annotated chart images across 14 visualization types using targeted Google Images queries.
Screening: Iterative exclusion of duplicates, non-data graphics, and charts without discernible annotation intent, reducing the corpus to 1,888 usable examples.
Coding: Qualitative open coding applied iteratively by multiple coders, converging on seven stable annotation categories with documented inter-rater reliability.
8,768
Images Initially
Collected
1,888
Annotated Charts
Analyzed
14
Chart Types
Covered
7
Annotation
Types Found
3
Case Studies
Demonstrated
Empirical Basis
All taxonomy categories emerge directly from observed annotation behavior in real-world charts—not from theoretical frameworks—ensuring the design space reflects genuine practice rather than designer intuition.
Coverage
Spanning 14 chart types and 8,768 initially retrieved images, the corpus captures the breadth of annotation practices across news, scientific, and business visualization contexts.
Outcome
Open coding converged on seven stable annotation types. Each is characterized by its task support (Why), visual form and ensemble patterns (How), and typical content provenance (What).
Application
Three case studies apply the framework to editorial charts from major news outlets, demonstrating how the [Why], [How], and [What] structure guides structured, reproducible annotation decision-making.
✦ Taxonomy

Seven Annotation Types

Seven annotation types emerging from open coding of 1,888 real-world charts. Filter by analytic task to narrow the view, or select any card to expand its full profile — empirical frequency, supported tasks [Why], ensemble patterns [How], data sources [What], and appearances in the case studies.

✦ Applications

Case Studies

Three annotated charts from editorial practice, each analyzed through the [Why], [How], [What] framework. Rows in the breakdown table map each annotation decision to its task intent, visual implementation, and content provenance—demonstrating how the framework enables structured, reproducible annotation reasoning.

✦ Citation

Cite This Work

@article{rahman2024annotation,
  title   = {A Qualitative Analysis of Common Practices in
             Annotations: A Taxonomy and Design Space},
  author  = {Rahman, Md Dilshadur and Quadri, Ghulam Jilani
             and Doppalapudi, Bhavana and Szafir, Danielle Albers
             and Rosen, Paul},
  journal = {IEEE Transactions on Visualization and Computer Graphics},
  year    = {2024},
  doi     = {10.1109/TVCG.2025.3565855}
}